In the digital age, numbers don’t lie. If you’re gunning to dominate the social media space in 2024, understanding the key metrics is non-negotiable. Social media marketing is an essential part of any brand’s marketing strategy. But with so many different platforms and statistics to keep track of, it can be tough to know where to start.
From the latest trends on TikTok and Instagram to the nitty-gritty of YouTube and Twitch, we’ve got you covered with 61 crucial social media marketing statistics you need to know ready for your 2024 campaign. Trust us, these figures aren’t just for show; they’re the building blocks of your next groundbreaking campaign. Ready to swap guesses for certainties? Let’s get started.
Table of Contents
Global Social Media Usage Statistics
- There are 4.95 billion social media users worldwide in 2023, that’s just over 60% of the whole population. There are 5.3 billion internet users worldwide in 2023, that’s just over 65% of the whole population.
- The typical working-age internet user (16-64 years) spends 2 hours and 31 minutes per day on social media and 6 hours 37 minutes per day on the internet.
- The most popular social network globally is Facebook with 2.958 million monthly active users. This is followed by YouTube (2.514 million), WhatsApp (2.000 million), Instagram (2.000 million), WeChat (1.309 million) and TikTok (1.051 million).
Social Media Usage Statistics in the United States
- There are currently 308.27 million social media users in the United States, a number that is expected to grow to 331.09 million by 2028.
- People in the United States have on average 7.1 social media accounts highlighting the importance of omnichannel marketing.
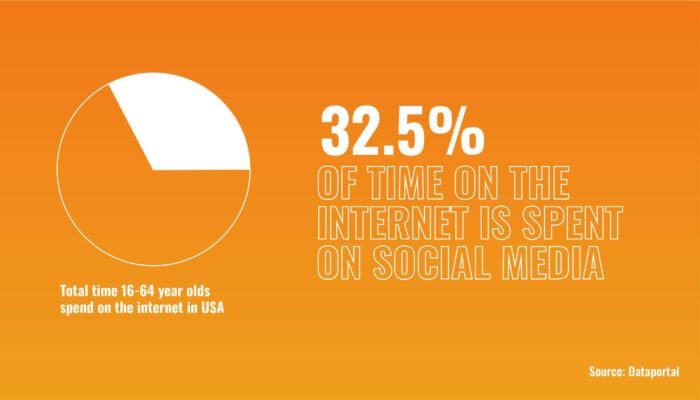
- On average, in the USA social media use accounts for 32.5% of the total time 16-64 year olds spend on the internet.
Social Media Advertising Statistics
- In 2023, TikTok will generate more US digital ad revenues than Twitter, Snapchat and Reddit combined.
- Digital’s share of global ad spend has increased by a relative 27.7% since 2019 – accounting for 73.3% of global ad spend.
- Average ad spend per internet user is significantly higher in the United States than anywhere else in the world, with $880 spent on average on advertising per US internet user per year. This is $344 higher than the next highest country, the UK, at $566 per person per year.
- 75% of people don’t accept advertisements as truth.
Social Media Engagement Statistics
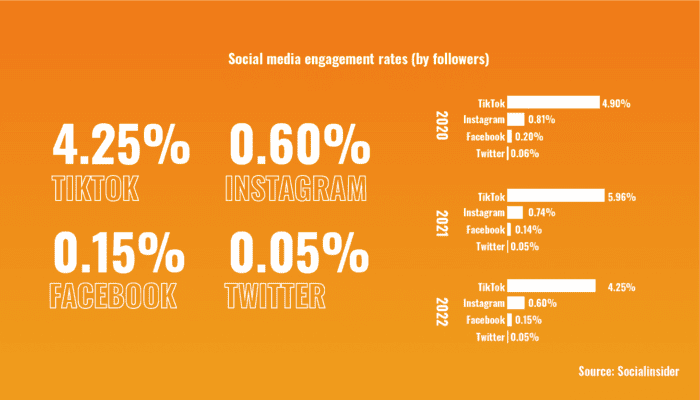
- TikTok has the highest engagement rate by a long way at 4.25% compared to Instagram 0.6%, Facebook 0.15% and Twitter 0.05%, but this has been falling over time.
- 80% of social marketers say that their main goal is to boost engagement cross social media.
- 51% of people are more likely to share videos with friends and family over any other content type.
Social Media Brand User Relationship Statistics
- 78% of consumers want brands to use social media to help people connect with each other. In fact, consumers ranked social media as the number one communication channel for connecting with their customers.
- The likelihood of making a purchase is 7% if not referred by social media, users are 71% more likely if referred by social media.
- 40% of consumers expect brands to problem-solve in the channels of their choice – i.e. Instagram message.
- 70% of consumers feel more connected with a brand if their CEO is active on social media, primarily because they feel there are real people behind the brand.
- 72% of people feel more connected to a brand whose employees share information on social media, primarily as they like learning about the people who make up the brand.
- The top behaviour that users report makes them feel more connected to a brand on social media is liking or responding to comments or messages with 55% of consumers reporting that this makes them feel more in touch.
Social Media Brand User Expectation Statistics
- 68% of consumers’ primary reason for following a brand on social is ‘To stay informed about new products or services’ – highlighting users’ expectations for this information to be shared on social media.
- 79% of consumers expect brands to respond to their social media messages within 24 hours.
- 72% of consumers want brands to be positive contributors to society, 64% to connect with their consumers, and 64% to use their power to help people.
Social Media Marketing ROI Statistics
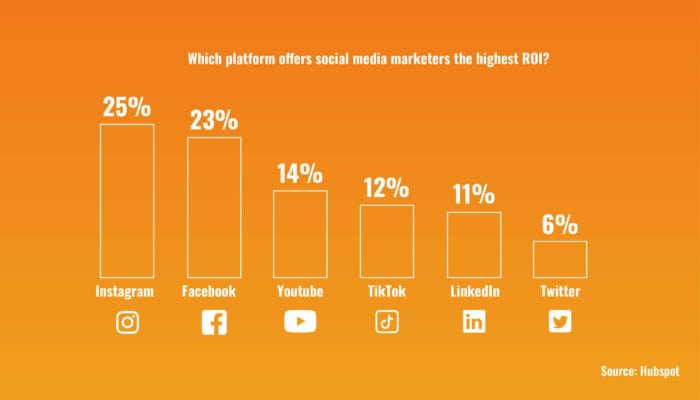
- Most marketers (25%) cite Instagram as the social media platform that provides them with the highest ROI. Less than 10% of marketers cite Twitter, Snapchat and BeReal as the best channel for ROI.
- 83% of marketers say that social media ROI is difficult to measure, with their main challenge being determining the appropriate metrics to use.
- The average ROI for social media ad campaigns is 250%.
- 96% of marketers agree that social media delivers positive returns.
Social Media B2B Marketing Statistics
- 95% of B2B marketers use social content as part of their content marketing strategy.
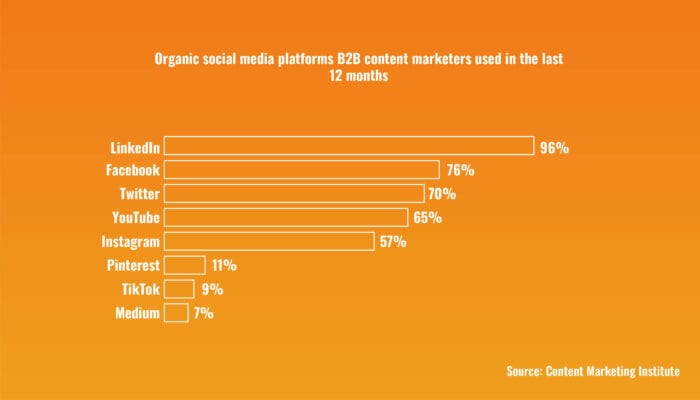
- LinkedIn is the most effective and top organic social media platform used by content marketers with 96% using the channel. This is followed by Facebook 76% and Twitter 70%.
- 85% of B2B marketers use social media advertising/promoted posts, making it the top paid content distribution channel.
- On average B2B buyers engage with 3-7 pieces of content before talking to a sales rep.
- 84% of B2B buyers or decision-makers are using social media at some point during their decision making process.
Social Media B2C Marketing Statistics
- 77% of B2C brands invested in video in 2023 and social media is the most common way for marketers to share video.
- Changes to social media algorithms are a top concern B2C marketers, with 53% stating it is a worry.
Social Commerce Marketing Statistics
- 47% of social media marketers say their brand sells directly within social media apps.
- Consumers aged 18-54 state that social media is the most common channel for discovering new products, with 48% on average saying they have discovered a new product on social media.
- Only 42% of social media users feel comfortable making purchases directly on social media platforms.
- Only 21% of consumers report the products they purchased on social media apps are high quality.
Social Media Marketing Growth Statistics
- BeReal (313%), Twitch (29%), LinkedIn (20%) and TikTok (16%) are the social platforms that have seen the most growth in the US since May 2022.
- Global social media advertising spending is expected to reach $263 billion by 2028.
- Global social media usage is expected to increase to almost 6 billion in 2027.
Instagram Social Media Marketing Statistics
- Instagram currently has over 1.4 billion monthly active users worldwide.
- 69.1% of Instagram users are under the age of 35.
- Reels account for 30% of the time spent on Instagram.
- Just 0.1% of Instagram users solely use Instagram, meaning there is a 99.9% chance they have an account on another social media platform.
- The average Instagram business account grows its followers by 0.98% per month.
- The average engagement rate on an Instagram business account post is 0.54%.
TikTok Social Media Marketing Statistics
- TikTok has over 1 billion monthly active users worldwide.
- 70.2% of TikTok users are under the age of 34.
- TikTok users use the app for an average of 1.5 hours every day.
- 90% of tiktok users report the platform makes the happy and never gets boring.
- TikTok has a potential ad reach of 945.2 million among users 18+.
- 50% of TikTok users have bought something after watching a Live.
- TikTok was ranked 1st as the most innovative advertiser among marketers globally.
Twitch Social Media Marketing Statistics
- Twitch has 140 million unique visits every month.
- More than 70% of Twitch viewers are between 18 and 34.
- Twitch brings in $231.8 million in annual advertising revenue – meaning it has more than doubled since 2017 $102.5 million.
YouTube Social Media Marketing Statistics
- YouTube has over 2.2 billion monthly active users worldwide.
- 62% of US YouTube users access the site daily.
- 59% of consumers say that YouTube ads are more relevant than ads on linear TV or other streaming apps.
- YouTube Shorts has crossed 50 billion daily views, up from 30 billion the year previous.
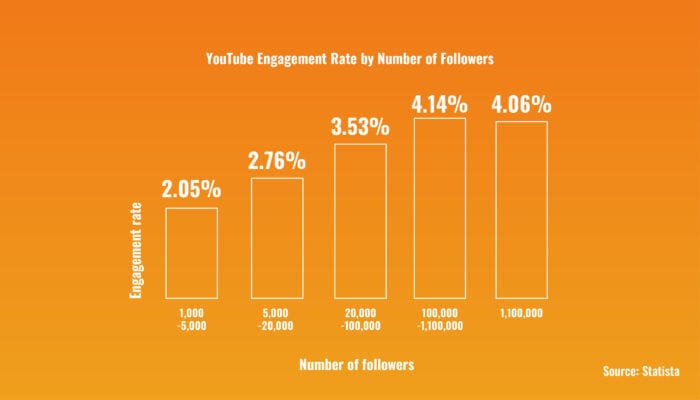
- YouTube influencers with between 100,000 and 1,000,000 followers get the highest engagement rates with an average of 4.14%.
Key Takeaways from These Social Media Marketing Statistics
Let’s focus on the key facts: Social media has evolved beyond being just a place for personal photos and jokes—it’s now a critical business channel. Businesses use it for targeted outreach, customer engagement, and sales conversion. The increase in both user activity and advertising budgets on social media platforms highlights the importance of a well-crafted social media marketing strategy. Instagram, TikTok, Twitch, and YouTube are platforms you can’t afford to ignore; each has its own audience and benefits that can be leveraged for business growth. In short, if your brand haven’t invested in a comprehensive social media strategy yet, now’s the time to start.
Concluding thoughts – Social Media Marketing
So there we have it—the essential social media marketing statistics that could be the making or breaking of your 2024 campaign. In this fast-paced digital realm, knowledge truly is power. Understanding the scope of each platform, from the viral dance crazes on TikTok to the long-form content giants on YouTube, can give you the edge you need to elevate your brand to new heights. These statistics aren’t just eye-catching numbers; they’re the compass guiding you through the labyrinthine world of social media marketing. If you want to be the brand that not only survives but thrives, it’s time to stop shooting in the dark and start making data-driven decisions.
Need help with your social media marketing? Let Goat guide you through the labyrinth of social media marketing with expertise that’s backed by hard stats and proven success. Whether you’re a startup looking to make a splash or an established brand aiming to deepen consumer engagement, we’ve got tailored solutions that are as dynamic as the social media landscape itself. Ready to stop playing catch-up and start leading the pack? Get in touch with us today.
